Calculating and Optimizing Performance Ratio (PR) of Industrial Solar Plants

📌 Executive Summary
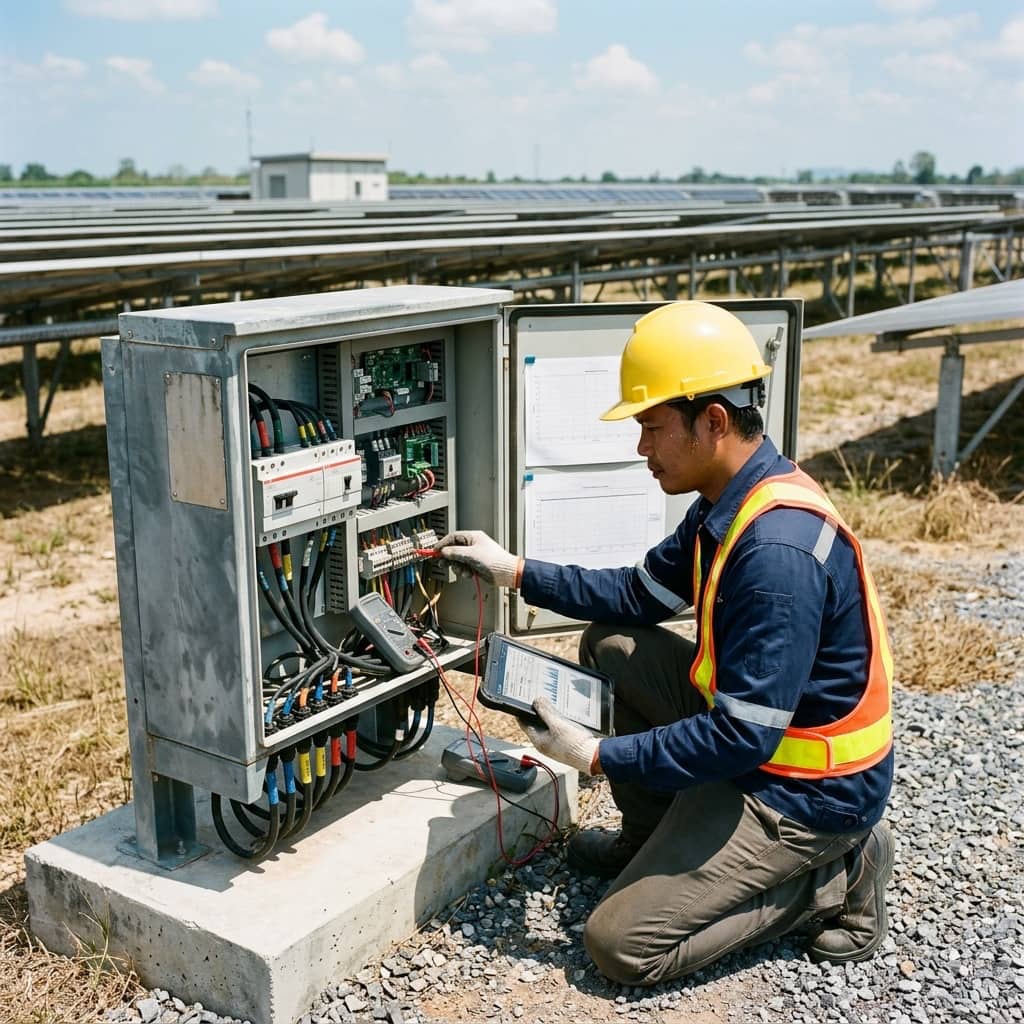
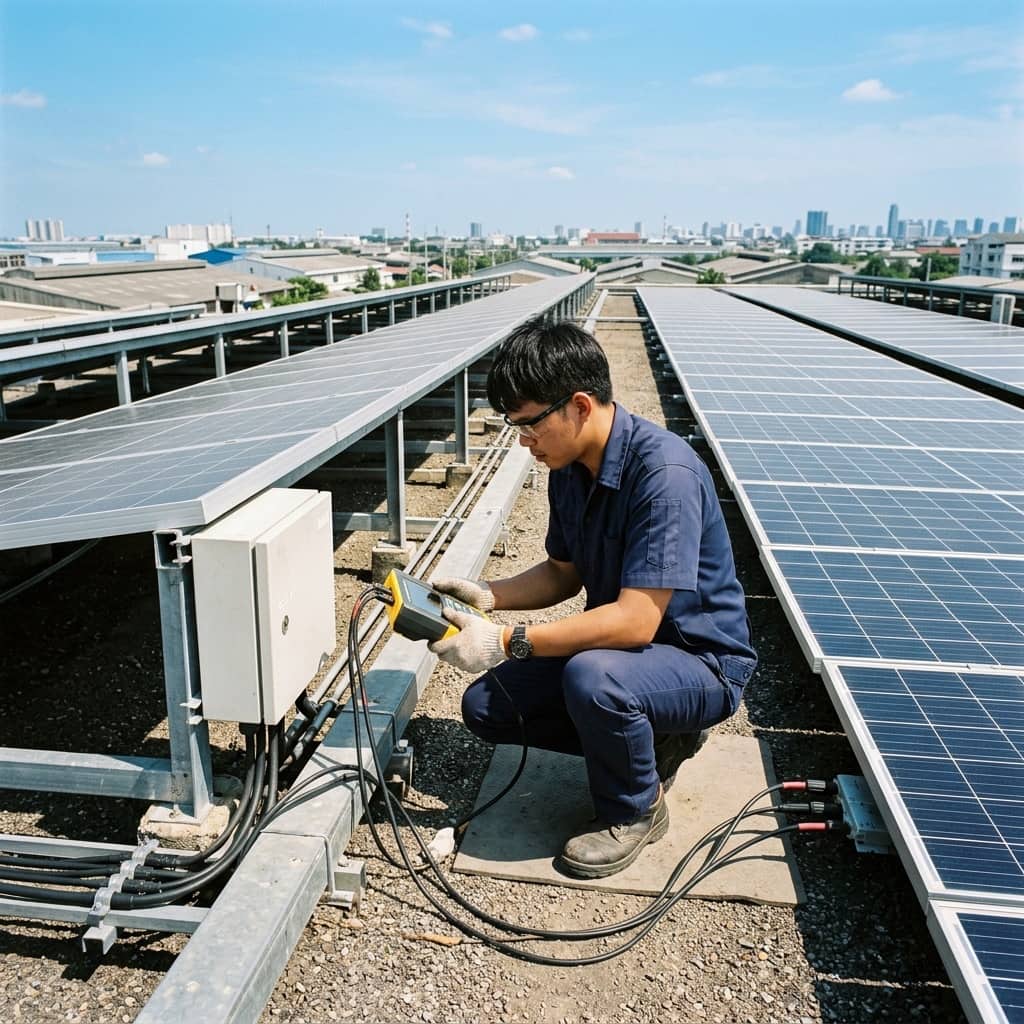
How to measure irradiance (Pyranometer), cell temperature, inverter losses, and calculate weather-adjusted PR values.
1. What Performance Ratio Is and What It Tells You
The performance ratio (PR) is a PV quality index that removes system size and solar resource from the equation, leaving only the question of how well the system converts received light into electricity compared with its theoretical potential. It is the ratio of actual energy produced to the energy the system should produce given the irradiance measured in the plane of array multiplied by installed capacity. PR therefore compares across systems, locations, and time periods, unlike raw energy figures that depend on weather.
The losses embedded in PR span module temperature above standard conditions, soiling on the glass, shading, cable losses, inverter efficiency, string mismatch, and equipment downtime. Continuous PR tracking is thus a primary O&M instrument that flags abnormality quickly — even in a sunny month when total energy still looks respectable.
2. Measuring Correctly per the IEC 61724 Approach
IEC 61724 (Photovoltaic system performance) is the reference framework for PV performance measurement and analysis, covering monitoring accuracy classes, irradiance sensor types and placement, and calculation methods for performance indices including PR. The heart of trustworthy measurement is the irradiance sensor: mounted in the same plane as the modules, calibrated on schedule, and kept free of shading and soiling — a dirty sensor reads low and inflates PR, hiding real problems.
For performance guarantee comparisons, define explicitly which PR is used: raw monthly PR, or temperature-corrected PR, which removes hot weather effects for fairer cross-season comparison. Also agree on data filters for low-irradiance periods and externally commanded outages. Without these definitions, the same PR number can be interpreted differently, creating disputes between the owner and the O&M contractor.
- Mount the irradiance sensor in the array plane
- Calibrate on schedule and clean the sensor regularly
- Define PR precisely in contracts (raw vs temperature-corrected)
- Agree data filters for low light and commanded outages
3. Loss Decomposition to Improve PR
When PR falls below target, the next step is loss decomposition — identifying where energy disappears. Compare DC and AC energy to isolate inverter losses; compare per-string or per-MPPT yield to find underperforming strings; analyze intra-day patterns, where shading losses repeat with sun angle while soiling suppresses output evenly all day and worsens gradually through the dry season.
Improving PR effectively means fixing losses in order of value: tune the cleaning schedule from measured soiling loss rather than a fixed calendar, remove shading from vegetation or structures added after installation, rebalance uneven MPPT loading, and cut inverter downtime by stocking critical spares. Recording PR before and after each corrective action also proves each measure's contribution concretely.
4. PR Interpretation Pitfalls to Avoid
The most common pitfall is comparing PR across seasons without temperature correction, misreading normal hot-season cell behavior as degradation. Next is a dirty or degraded irradiance sensor that flatters PR. Some systems substitute satellite irradiance data for physical sensors — reasonable for long-term overviews but highly inaccurate day to day. And plant-wide PR averaging can bury a chronically underperforming zone that no one notices.
Good practice reads PR alongside other indices such as availability and specific yield, sanity-checks sensor data against independent references periodically, analyzes at string or sub-inverter level rather than the aggregate alone, and sets a baseline from the commissioning period so year-over-year comparison reflects genuine system degradation rather than measurement noise.
- Use temperature-corrected PR for cross-season comparison
- Verify sensor condition before trusting the numbers
- Analyze per string/inverter, not only the plant average
- Set the baseline from the commissioning period
Need engineering consultation regarding Solar & Clean Energy?
The WIN TECH SERVICE engineering team is ready to provide site surveys, electrical system inspections, and prepare accurate legal certification reports.