Class A Power Quality Analyzers (IEC 61000-4-30 Class A) Compliance
📌 Executive Summary
Why Class A measurement accuracy and synchronization are required for legal dispute resolution and utility power quality audits.
1. Why Instrument Accuracy Class Matters
Power quality measurements decide high-stakes questions: attributing responsibility for equipment damage after voltage events, accepting machinery installations, and resolving disputes between customers and the utility. If two instruments disagree because their internal algorithms differ, an engineering conclusion instantly becomes an argument. This is why IEC 61000-4-30 defines instrument classes that force identical measurement methods on every instrument claiming the same class.
The standard defines Class A, with strictly specified algorithms, aggregation intervals, time stamping, and uncertainty, and Class S, relaxed for general statistical surveys. Two Class A instruments measuring the same signal must agree within the stated uncertainty. That property makes the results defensible as reference evidence in contested matters, which is why substation-level work and standards compliance verification typically specify Class A as the minimum requirement.
2. Key Provisions of IEC 61000-4-30 Class A
The core of Class A is the 10-cycle basic measurement window for 50 Hz systems and the gapless aggregation structure of 150-cycle, 10-minute, and 2-hour intervals, with precise time synchronization so events can be compared across instruments. Covered parameters include frequency, voltage magnitude, flicker (referencing IEC 61000-4-15), harmonics and interharmonics (per IEC 61000-4-7 methods), unbalance, dips, swells, interruptions, and mains signaling voltage.
Another key concept is data flagging: when a dip or interruption occurs during an aggregation interval, the instrument flags the affected aggregate to prevent one disturbance being counted repeatedly across several parameters. Users must understand this mechanism when reading reports, since interpreting flagged values without context can lead to wrong conclusions. The voltage and current transformers feeding the instrument must also have consistent accuracy classes, or the transducers will limit the overall measurement chain.
- 10-cycle basic window and gapless aggregation
- Precise time sync for cross-instrument event comparison
- Flagging prevents double-counting one disturbance across parameters
- VT/CT accuracy classes must match the instrument
3. Planning Measurements at Substations and Intake Points
Measurement campaigns at a high-voltage intake or plant substation should begin with a clear objective: baseline data before new load installation, IEEE 519 compliance verification, or event monitoring of sags affecting production. The objective drives instrument placement, number of points, and duration. Baseline surveys typically need at least one continuous week, while event monitoring warrants permanent installation reporting to a central system.
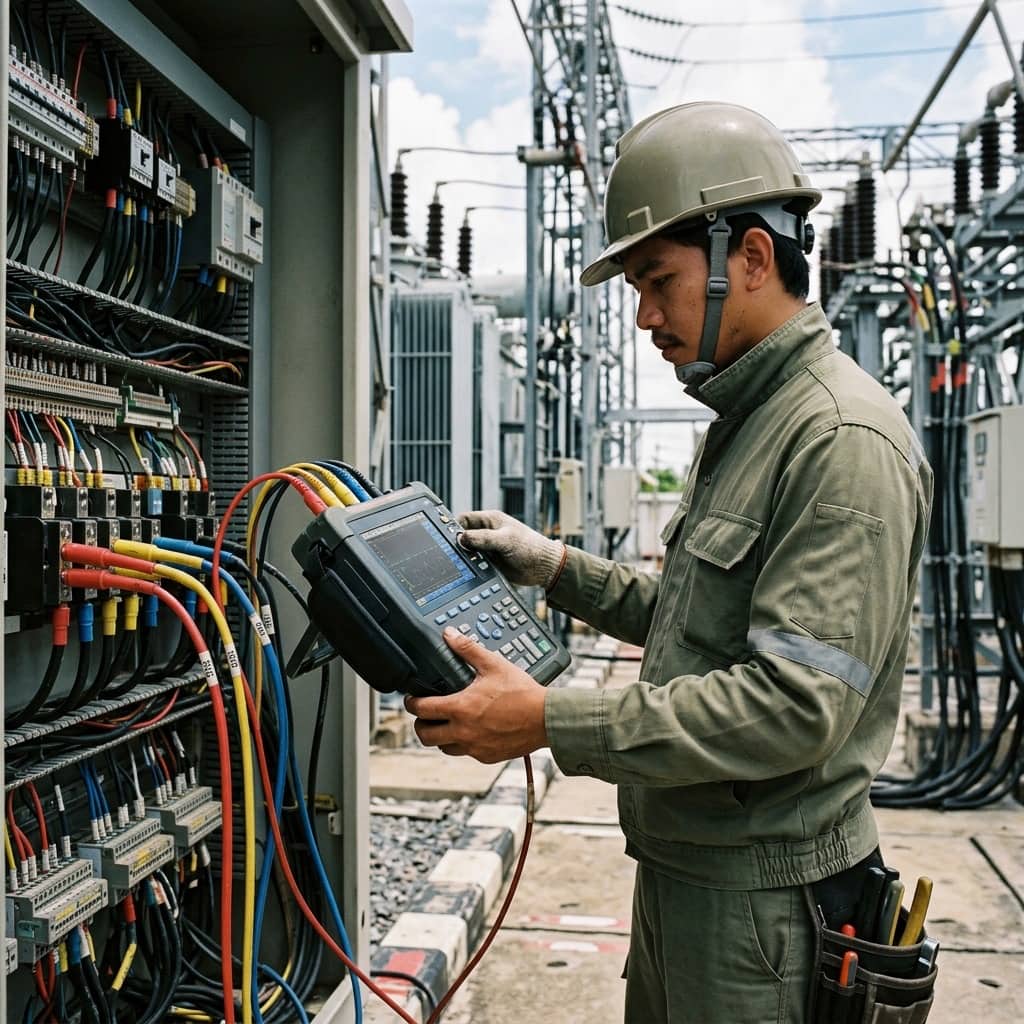
Field installation demands rigor in safety and signal integrity: connecting via VT/CT secondary circuits with proper test points, verifying phase sequence and CT polarity before recording, setting transformation ratios correctly, and synchronizing time to a reference source. Data completeness should be verified on site before demobilizing, because discovering corrupted data after removal means repeating the entire campaign, an expensive proposition at high-voltage measurement points.
4. Interpreting Results and Common Mistakes
The most frequent mistake is using an unclassified general-purpose meter for contested work, only to find later that the other party rejects the results. Next come wrong CT ratio settings, swapped phases, measurement windows too short to capture key load cycles, and reading THD without knowing the reference current basis, which corrupts comparison with IEEE 519 TDD limits.
Good practice is a report presenting statistical values such as the 95th percentile of each parameter, an event list with timestamps and characteristics, and comparison against clearly cited criteria, for example EN 50160 for voltage characteristics or IEEE 519 for harmonics, with instrument calibration records attached. A complete report of this kind not only answers the technical question but withstands review by independent engineers and supports negotiation with counterparties.
- Use Class A instruments wherever results may be contested
- Always verify CT ratio, phase sequence, and polarity before recording
- Report 95th percentile values with a full event list
- Attach instrument calibration records to every report
Need engineering consultation regarding Power Quality & Energy?
The WIN TECH SERVICE engineering team is ready to provide site surveys, electrical system inspections, and prepare accurate legal certification reports.